Highlights
- Got an advanced data processing and visualization IoT solution based on modern technologies
- Developed a user-friendly interface comprehensible by any user
- Ensured that real-time data updates and visualization works smoothly on all devices
Technologies Used: MySQL, React, Python, RabbitMQ, AWS Cloud, AWS IoT
Methodology: Scrum
Customer
The customer is an expert manufacturer and supplier of dirty water pumps and slurry pumps, for use in mining, recycling, and quarry dewatering. The pumps are located all over the world, and the customer needed a solution that will help to control all the pumps: monitor their status in real-time to see, when exactly they need maintenance services.


Need
When the customer turned to HQSoftware, they already had a LAMP-based solution that was quite difficult and not so stable in use. The site operatives used this data to control pumps performance, but the system lacked usability and needed to be re-developed from scratch.
Also, for proper pump maintenance, it is important to see sensor logs in real-time, which was also impossible with current system functionality. This was also one of the top priority functions to develop.
Looking for similar solutions or something unique to your needs?Contact us today! We’re happy to explore your needs!
Victoria Rokash
Business Development Manager

Challenges
In the course of the project, the development team had to cope with the following challenges:
- Re-develop the whole solution so that it meets modern technology requirements and standards;
- Provide a modern and user-friendly interface;
- Build a powerful data processing and visualization system that any user can comprehend;
- Make sure that data rendering is manageable by the front-end, including the mobile version of the system.
All of them were successfully handled by the development team in the course of the project.
Solution
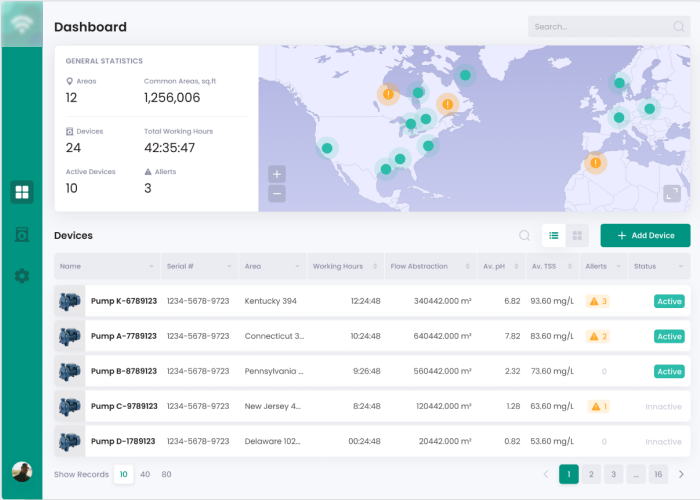
All pumps that are installed on the deposits are equipped with sensors that send data in real-time. These sensors track the following parameters:
- pH level;
- Water flow rate;
- Turbidity
- Temperature;
- Fluid levels;
- Running current;
- The percent opening of a valve
- Pressure.
These sensors are a part of a large IoT network that receives data from the devices and stores it in the secure AWS Cloud, processes it, and shows it to users on a dashboard.
In the solution, there are three types of users:
- Admin. Can view and edit all companies, sites, devices, and sensors.
- Manager. Can view and edit data about sites only assigned to them.
- Site operative. Can only view assigned sites.
The system consists of two large parts:
- Admin panel. Available only to admins of the system who can create new data entities for deposits, pumps, and devices. Admins can also create data templates for typical deposits or pumps.
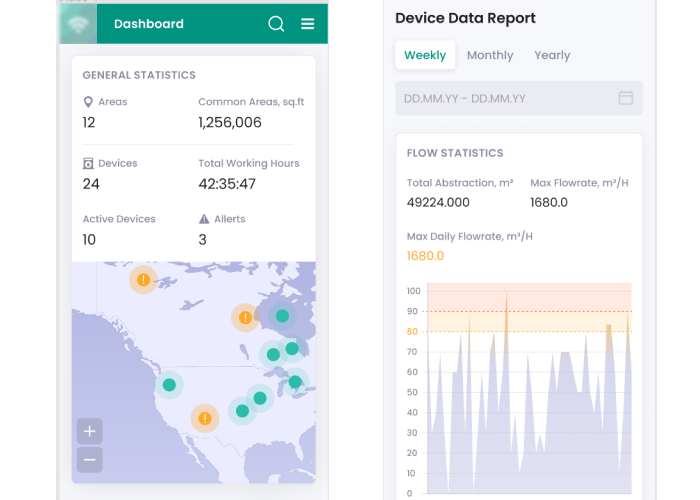
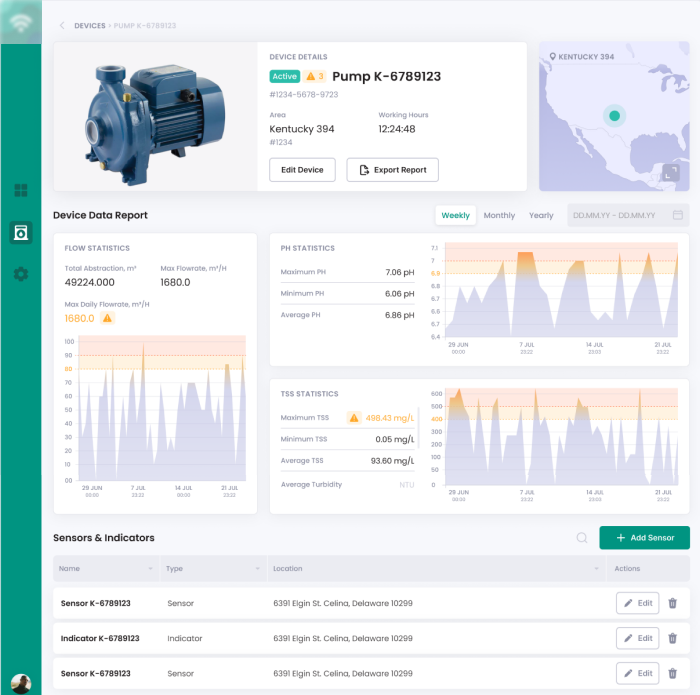
- Dashboard. A data visualization module that processes data collected from the pump sensors and displays it via charts, graphics, and other formats. The dashboard also shows where the sensors are located geographically, and updates all data in real-time. For particular data types, admins can set limits, and the system will send notifications and alerts upon reaching the limit.
In addition to dashboards that show dynamic data, the solution also provides a reporting function. Along with ad-hoc reports, once a week the solution automatically builds reports about device performance and sends them to all admins.
For the successful project execution, the development team was built this way:
- From the customer’s side: product owner, Chief Technical Officer.
- Front-end and back-end developers, project manager, QA, DevOps.
Outcome
Partnering with HQSoftware, the customer developed the required solution successfully and got a modern system with real-time data synchronization.
With new powerful backend functionality that provides data analysis and processing, the customer now has the ability to see the full picture: how pumps work, what sensors logs are right now, how often and when the pumps need maintenance services, and so on.
Another great accomplishment was that now the system is easily accessible and user-friendly to non-tech-savvy users. Even staff with no prior technical experience can understand how to use the dashboards and reports, and read sensor logs with ease.
The solution is already live and the customer uses it to its full extent.
Check Out Other Works
See How We Approach Business Objectives

We are open to seeing your business needs and determining the best solution. Complete this form, and receive a free personalized proposal from your dedicated manager. Sergei Vardomatski Founder