Highlights
- Winning a customer a strategic enterprise client
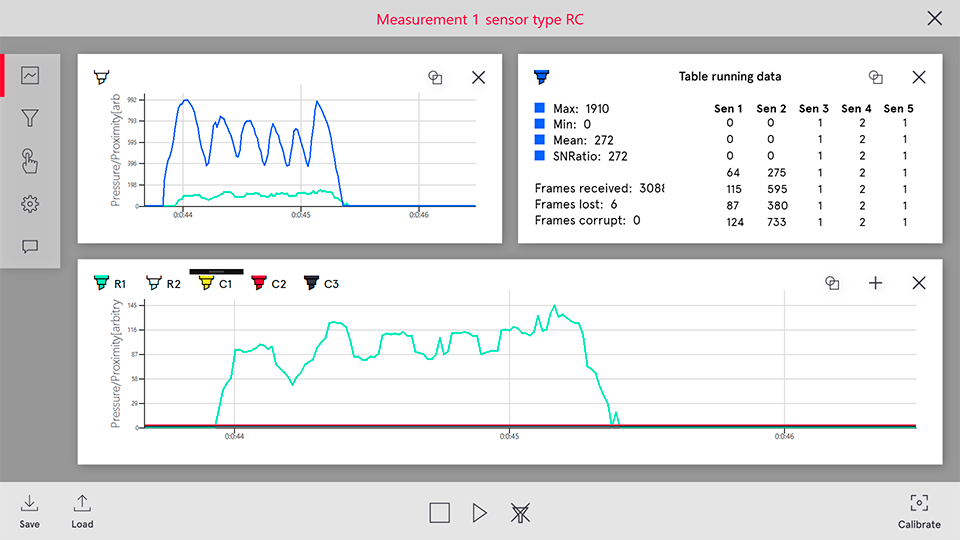
- Visualizing data in near real-time
- Building diagrams and configuring interaction profiles
- Simplified tuning of smart skin and vivid demonstration of its capabilities
- Featuring brand new Microsoft Fluent Design
Technologies Used: .NET, Windows Presentation Foundation
Methodology: Agile
Customer
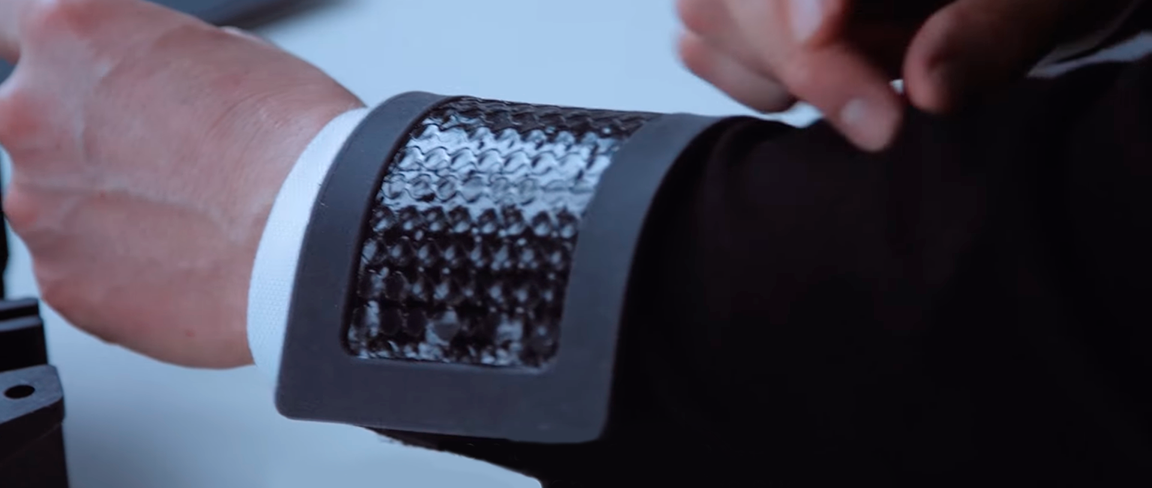
Based in Germany, the company is engaged in producing smart skin—a sensor-based flexible silicone layer that is easily stretched to take the necessary shape. The product is further used as a cover layer of any system that needs to be sensitive to touch and pressure of any strength (e.g., one can even apply a hammer against a sensor).
At the moment, the customer offers two types of smart skin: one relying on projected capacitance and the other relying on the measurement of electrical transfer resistivity, both ensuring high touch interaction experience.


Need
Underlying smart skin, a customer had an analog digitizer that turned impulses gathered by sensors into data and a controller that could be connected to a tablet or a laptop.
Partnering with HQSoftware, the company wanted to develop a system that would visualize data gathered and configure interaction profiles—a sequence of manipulations with sensors (e.g., a hover, a click, etc.). On analyzing the sequence, the system decides if the action was completed or not. The main goal of the developed solution was to improve the tuning of smart skin and ensure vivid demonstration of its capabilities to potential clients.
Looking for similar solutions or something unique to your needs?Contact us today! We’re happy to explore your needs!
Victoria Rokash
Business Development Manager

Challenges
Under the project, the team at HQSoftware had to address the following challenges:
- As data is recorded at a frequency of 80 hertz and tablets commonly have low-power processors and limited memory, the system should be able to visualize data in near real-time with no loss to precision.
- Meeting the customer requirement, the solution needed to feature Microsoft’s Fluent Design System as a design paradigm and its acrylic elements. However, this system was still under development and was due to be part of the upcoming Windows 10 release.
Solution
While choosing a technology behind data visualization and diagram building, engineers at HQSoftware compared several third-party libraries, including LiveCharts, SciChart, and Dynamic Data Display. The last library of the mentioned showed the best performance results and, therefore, joined the stack. In addition, specialists at HQSoftware detected bottlenecks of the Dynamic Data Display library and fixed them, thus achieving enhanced performance.
To make it possible to visualize data in near real-time, our developers also enabled data reduction. Thus, the solution would build diagrams based on three out of five data samples received at a given time. Not affecting the precision due to the high frequency of samples, the approach allowed for significantly boosting performance on low-power devices.
Teamed up with a designer, specialists at HQSoftware delivered algorithms responsible for imitating the acrylic pattern/effects of the new Microsoft’s Fluent Design System.
Outcome
Partnering with HQSoftware, the customer delivered a data visualization solution that builds diagrams and configures interaction profiles based on data gathered from the company’s smart skin product.
The developed system makes it possible to better tune sensor-based skin and improves visual demonstration of its capabilities. With it, the customer was able to sign a contract with an enterprise that is eager to adopt smart skin technology.
As part of further collaboration with HQSoftware, the customer plans to add new features, deliver support for devices that allow gathering/processing data from hundreds of sensors, as well as exploit new types of sensors.
Read more about our IoT services and solutions.
Check Out Other Works
See How We Approach Business Objectives

We are open to seeing your business needs and determining the best solution. Complete this form, and receive a free personalized proposal from your dedicated manager. Sergei Vardomatski Founder