Highlights
Need
The manufacturer needed to catch pending equipment failures before they happened, instead of relying on fixed maintenance schedules that ignored the actual condition of each machine.
Solution
A real-time monitoring system that learns what normal behavior looks like for each machine and alerts engineers to early warning signs before a breakdown occurs.
45%
reduction in unplanned downtime
85%
failure detection rate (recall)
Less than 8%
false positive rate
24–48 hours
advance warning before failure
Outcome
Thanks to its collaboration with HQSoftware, a manufacturing company achieved its business goals. Unplanned breakdowns that once cost far more to fix than routine maintenance are now caught days in advance. Engineers know which machine to check and what to look for before anything fails. This turns maintenance from reactive firefighting into proactive planning.
Customer
A manufacturing company running industrial equipment that was previously serviced on a fixed schedule regardless of how each machine was actually performing. Some machines went in for maintenance they didn’t need, while others broke down between scheduled checks.
Since unplanned downtime cost significantly more than routine maintenance, the company needed a way to understand the real condition of its equipment, not just the calendar date of its last service. Years of sensor data and failure logs were already stored electronically, which made it possible to train a model on real patterns of normal operation rather than starting from scratch.


Business Need
The system was built to address three connected problems the maintenance team faced every day:
- No early warning: Failures were discovered after the fact, leaving no time for a planned response.
- No prioritization: When multiple machines showed signs of wear, engineers had no way to decide which one to check first.
- No visibility: There was no single view showing the current health status of all equipment across the facility.
Solution
The HQSoftware team built a system that continuously watches live sensor data (measuring temperature, vibration, pressure, and rotation speed) coming off each machine and learns what “normal” looks like for that specific piece of equipment. When a machine’s behavior starts drifting from its usual pattern, the system raises a flag well before a breakdown happens.
Each alert tells engineers exactly which sensor readings looked unusual, so they know what to inspect without digging through raw data. Because different machine types behave differently, a separate model is trained for each equipment type rather than applying a one-size-fits-all approach. This significantly reduces false alarms and keeps alerts actionable.
How It Works
1. Data Collection
The system was trained on over 1,5 years of sensor telemetry recorded every 10 seconds across multiple sensor channels (temperature, vibration by axis, pressure, RPM), combined with failure logs, maintenance records, equipment specs, and production logs.
2. Learning Normal Behavior
For each equipment type, a model is trained exclusively on healthy operating data. It learns to reconstruct a rolling 30-minute window of sensor readings; the harder that reconstruction becomes, the more the machine is deviating from normal. The alerting threshold is calibrated against historical failure dates to ensure real problems are caught at least 24 hours in advance.
Looking for similar solutions or something unique to your needs?Contact us today! We’re happy to explore your needs!
Victoria Rokash
Business Development Manager

3. Real-Time Scoring
Sensor data streams in continuously through AWS Kinesis and is scored in near real time, with results available in under 2 seconds. When a machine’s deviation from normal crosses the threshold, the system triggers an alert immediately.
4. Alert Generation and Routing
Each alert identifies the specific machine, the timestamp, and the sensors driving the anomaly—for example, a rising bearing temperature or unusual vibration on the Z axis. Engineers receive a clear, specific signal rather than a vague warning, so they can act without further investigation.
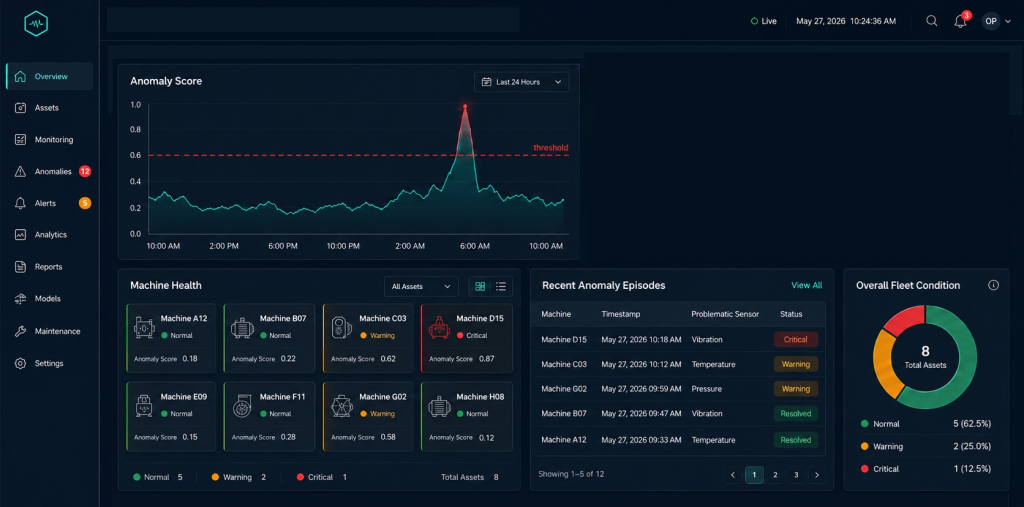
5. Dashboard and Monitoring
A live dashboard displays the current anomaly score for every machine, a history of past anomaly episodes, and how sensor readings behaved in the period leading up to each alert.
Challenges
- One model does not fit all machines. A lathe and a conveyor belt behave completely differently. Applying a single shared model across equipment types produced too many false alarms, so a separate model is trained and maintained for each equipment type.
- Getting the sensitivity threshold right. The threshold had to be precise enough to catch real failures early, without generating so much noise as to erode engineer trust. It was validated against historical data with known failure dates, to balance early detection with a false positive rate below 8%.
- Real-time, not batch. Providing a 24- to 48-hour warning only matters if the alert reaches engineers fast enough for them to act. The system needed to score incoming sensor data in near real time, not overnight.
Team
- Project manager
- ML engineer / Data engineer
- Full-stack developer
- DevMLOps
Learn more about our Artificial Intelligence development services.
Check Out Other Works
See How We Approach Business Objectives


We are open to seeing your business needs and determining the best solution. Complete this form, and receive a free personalized proposal from your dedicated manager. Sergei Vardomatski Founder